Week Ahead 7-26
admin on 07 26, 2010
Momentum is your friend. If you can gauge the momentum you can trade/invest. Momentum is calculated by the mass * velocity. So for the stock market we can gauge use volume to replace mass and velocity can be replaced with some measure of movement. This movement could be how far the market has moved (price action) or how many stocks have moved. This will really depend on your style of trading. For an individual stock the easiest things to use are the volume and the price action. Every trader should pay attention to the volume that is moving your stock and the action that it is associated with. Volume must drive movement because if there is no volume then our momentum does not have any support to keep it going. Volume comes from two directions so when positive (buyers) volume outweighs negative (sellers) volume the stock goes up and the opposite holds true as well.
So when we are trying to gauge our momentum we want to look for areas where volume has come into to support or resist the stocks movement. These align with critical turning points in the past. We have talked about the pivot points and using these as buying/selling/stops areas.  They are also critical to momentum because they should constantly test the validity of the move. If a stock is increasing in price with volume and that volume dries up near a resistance point then there is no way that it will get through that resistance. If volume surges and pushes price through the resistance then the momentum is intact and should extend higher. Once the volume fades the move will too.
One thing that I look at for the continued momentum is to see where the market or stock closed on the previous bar. This seems pretty simple but is very powerful. If you keep an eye on where the stock closes it should give you some predictive value for going forward. If the stock closes at the highs or lows then most likely the stock will continue in that direction. If it closes in the middle of the range, then there is doubt in the current move. Every move has pauses, but if there are several bars of pauses then this could be a sign that the move is over.
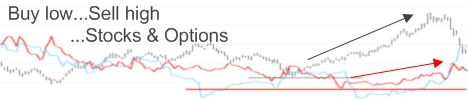
The best thing I can do is to show you on a chart:

Hopefully you can see the arrows and how they tend to guide you along the way for what may be coming. Not every bar can predict the future, and this cannot be used in isolation. Momentum and the bars should be used in combination with all of your other indicators to help guide your decision making process for timing. Fundamentals are a whole different story.
I will not go off on the tangent of the underlying fundamentals of our economy, let’s just leave it as “nothing has changed.” The things that we have to pay attention to is that this entire rally was built off of the short squeeze that we called a few weeks ago. Institutions can turn this into a serious rally if they can get it above resistance around 10.5k on the INDU and 1122 on the SP500. It would be hard for any bear to question the scamper that could come from more short squeezing above a major resistance point. One thing I have been trying to keep as a mental note is the mid term elections and when the rally and hold mentality will start. I think it is still a little early, but the institutions have been working hard to keep this market afloat. Stay alert to your momentum and make sure you protect your portfolio.
Popular Posts
Recent Posts
Recent Comments
- CheapIV.com » Why You can Throw Traditional Diversification in the Trash: ... have spent their
- Tim Geithner – China’s Laughing Boy - Trade the E-minis: ... Learn how Timmy
- Tim Geithner – China’s Laughing Boy | Notes from the E-mini Trading Professor: ... Learn how Timmy
- Swing Trading Stock: ... Learn Timmy Next
- Timmy Geithner has Cried “Wolf” Too Many Times | THE ART OF EXCESS: ... Learn how Timmy